Mathematics (Line Graph)
Subject: Mathematics
Grade: 6
Strand: Statistics and Probability
Focus Question: In what ways can I represent and interpret information?
A line graph a chart that shows a line joining several points or a line that shows the relation between the points.
Parts of a Line Graph

The image shown above represents the components of a line graph.
Title: It tells us about the data for which the graph is drawn.
X-axis: It tells us about the label on the x-axis, which is the time interval (days of week in the above example).
Y-axis: It tells us about the label on the y-axis, which is the quantity (muffins sold in the above example).
Scales: The horizontal and vertical scales tell us the quantitative value of “how much” or “how many”.
Points: It represents the (x, y) ordered pair.
In the given figure, the point represents that five muffins were sold on Monday.
Trend: You need to connect the points to make the graph. The meeting point of the label on the x-axis and y-axis reveals the movement.
Learning Activities
All Levels will complete the following quiz

Tier 2


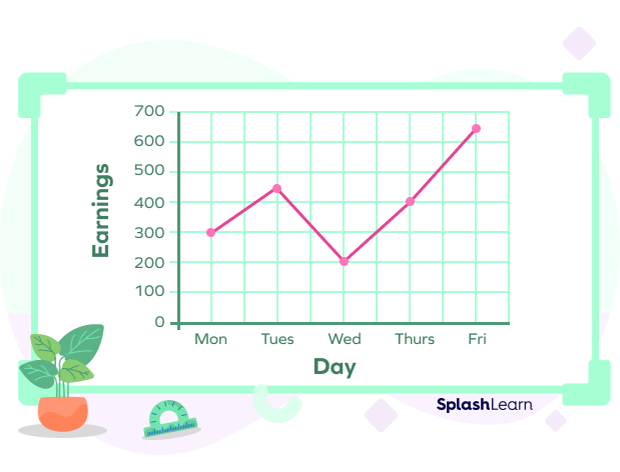
Using the graph, find the days on which the earnings are over
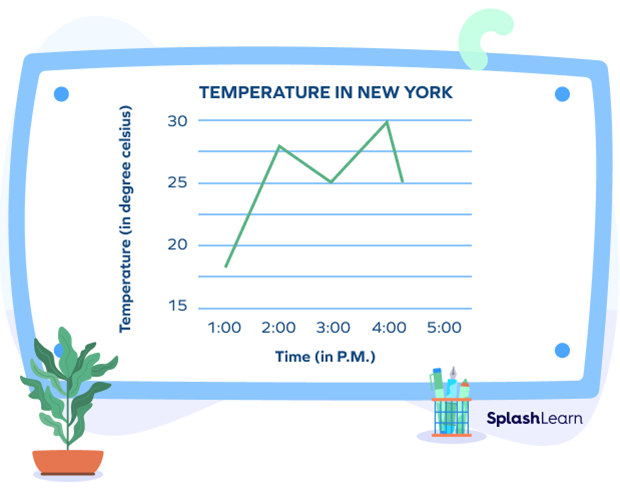
Look at the graph below. At what time was it the hottest?
Given below is a graph that shows the number of trees planted by an agency every year. Find the year in which the maximum number of trees were planted and the year in which the minimum number of trees were planted.
Extension Activities
Interpret Line Graphs 10.22 - Quiz


Comments
Post a Comment