Mathematics/ Bar Graph

  Subject: Mathematics

Grade: 6

Strand: Statistics and Probability

Focus Question:  In what ways can I represent and interpret information?
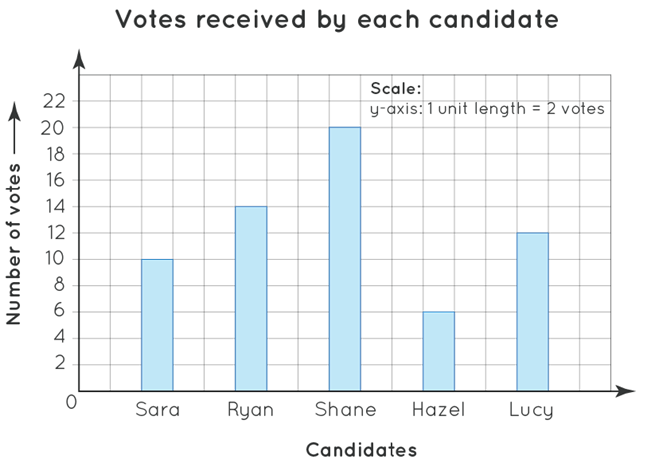

Bar Graphs

Bar graphs show data with rectangular bars or columns.

Bar Graphs are mainly classified into two types:
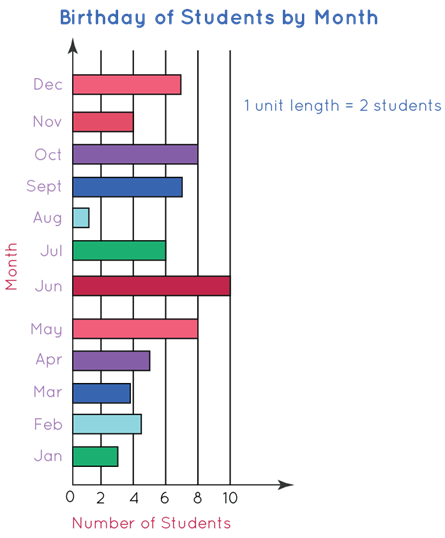
Labelling a bar chart

Lets's Practice

 State true/false.

Bar graphs are the pictorial representation of grouped data and are also referred to as bar charts

The graphs can be plotted vertically (bars standing up) or horizontally (bars lying flat from left to right).

Assessment

Bar Graph Worksheet

Complete the following

Tier 2

1) In a survey about customers’ favorite toppings, the results were recorded in the form of the bar graph. Use the bar graph to answer the given questions.

a. Which is the most popular topping? _________________

b. Which topping has 250 votes? _________________

2) Adam, Maria, Scott, Frank and Linda walk through the library and grab books. The data shows the number of pages read by each of them. Represent the data in a bar graph.


Tier 1 Use Graph sheets to complete the following
1. The number of cars manufactured by a factory for five consecutive weeks is shown below:

Week             Number of cars
First                         600
Second                 800
Third                 700
Fourth                 300
Fifth                 900

a. Draw a bar graph to represent the data.
b. How many cars were manufactured on week third?

2. Use the frequency table to draw a bar graph.

Type of food         Number of people
Italian                     30
Indian                     50
Mexican                      40

3.State true/false.
Bar graphs are the pictorial representation of grouped data and are also referred to as bar charts.

4. All students of Class 5 voted for selecting their class monitor. There were five candidates. All the students cast one vote each. The bar graph shows the results.

Who received the maximum number of votes? _______________
How many students voted in this election? ___________________
What was the difference between the highest vote and the lowest vote? _____________

Tier 3 (Beginners)
Look at the following bar graph

The above bar graph is an example of which type of bar graph?
a. Horizontal Bar Graph
b. Vertical Bar Graph

2. Sylvia went shopping and bought party balloons, bows and baskets for a party at home. The bar graph given below represents the party supplies she bought.

 
a. How many balloons did she buy?
b. Are the number of baskets greater than the number of bows?

Extension Activities

Bar Graphs 1851845 | Mr. Marky Go | Live Worksheets

Bar Graphs 1714324 | Victo08 | Live Worksheets

Bar Chart 1817204 | Yakub Susanto | Live Worksheets

Bar Graph Label 2 - Labelled diagram

Bar Graph Questions - Quiz

Bar Graph Questions - Gameshow quiz


Comments

Post a Comment

Popular posts from this blog

Exponential Games

Worksheets

Singular and Plural Nouns