Circle Graphs Grade 6
Mathematics
Fq: How do we represent and interpret information?
Circle Graphs
A circle graph is a graph in the shape of a circle that shows different parts. Each part of a circle graph represents a different category. You can use a circle graph to visually compare the parts to the whole, and the parts to each other.
Example
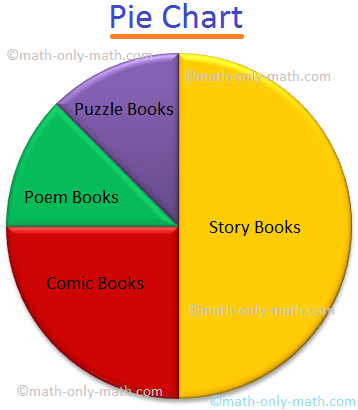
Given below is a pie chart showing the type of books preferred by the students of a class. Observe the chart and answer the questions given below.
(i) What fraction of students like Comic books?
Answer: The sector in the pie chart shows =
(ii) What fraction of students like Story books?
Answer: The sector in the pie chart shows =
(iii) Which 2 books have equal fraction of preference?
Answer: Poem and Puzzle books.
(iv) What fraction of students does not like story books?
Answer:
(iv) Which type of book do you like to read?
Answer: Comic books
Example 2
Solved Example on Construction of Pie Chart/Pie Graph:
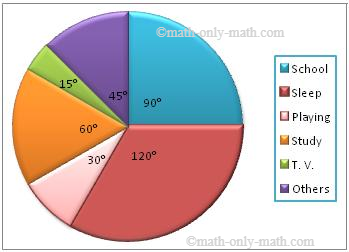
1. The following table shows the numbers of hours spent by a child on different events on a working day.
Represent the adjoining information on a pie chart
| Activity | No. of Hours |
| School | 6 |
| Sleep | 8 |
| Playing | 2 |
| Study | 4 |
| T. V. | 1 |
| Others | 3 |
The central angles for various observations can be calculated as:
| Activity | No. of Hours | Measure of central angle |
| School | 6 | (6/24 × 360)° = 90° |
| Sleep | 8 | (8/24 × 360)° = 120° |
| Playing | 2 | (2/24 × 360)° = 30° |
| Study | 4 | (4/24 × 360)° = 60° |
| T. V. | 1 | (1/24 × 360)° = 15° |
| Others | 3 | (3/24 × 360)° = 45° |
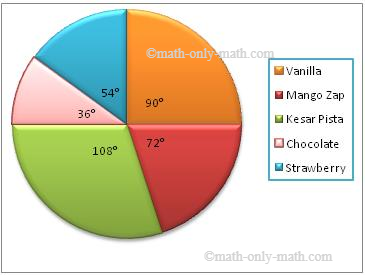
2. The favourite flavours of ice-cream for the children in a locality are given in percentage as follow. Draw the pie chart to represent the given information
| Flavours | % of Students Prefer the Flavours |
| Vanilla | 25 % |
| Strawberry | 15 % |
| Chocolate | 10 % |
| Kesar-Pista | 30 % |
| Mango Zap | 20 % |
The central angles for various observations can be calculated as:
| Flavours | % of Students Prefer the Flavours | Measure of Central Angles |
| Vanilla | 25 % | (25/100 × 360)° = 90° |
| Strawberry | 15 % | (15/100 × 360)° = 54° |
| Chocolate | 10 % | (10/100 × 360)° = 36° |
| Kesar-Pista | 30 % | (30/100 × 360)° = 108° |
| Mango Zap | 20 % | (20/100 × 360)° = 72° |
Now, we shall represent these angles within a circle to obtain the required pie graph.
Questions and Answers on Construction of Pie Chart:
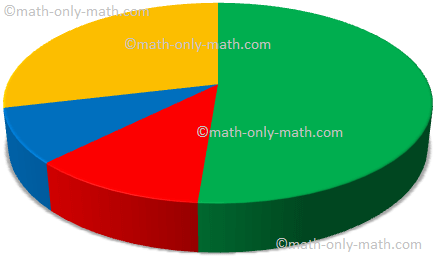
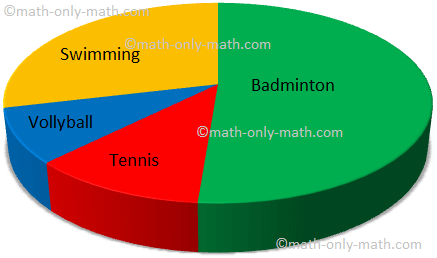
1. 80 girls were asked about their favourite sport? The collected information is given in the table. Read the information and label the graph.
Sports | Number of Girls |
Badminton | 41 |
Tennis | 9 |
Swimming | 23 |
Volleyball | 7 |
Answer:
Practice 1
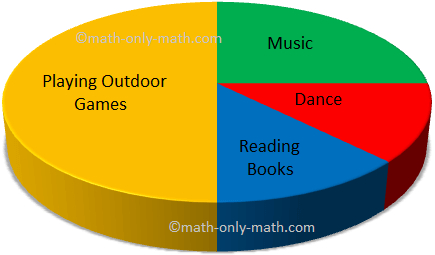
2. 100 students of a school were surveyed for their favourite activity. The information is represented in a pie chart as given below. Observe the chart and answer the questions given below.
(i) Which is the most favourite pastime activity of students?
(ii) How many students like music?
(iii) What percentage of students like to dance?
(iv) What percentage of students like to read books?
Assessment
Click and complete the following
pie-graph-beginners.pdf (tutoringhour.com)
fractions-and-percents.pdf (tutoringhour.com)



Comments
Post a Comment